


Thank you, as always, for reading the Devils’ Advocates Substack! If you enjoy the quasi-daily content, please consider subscribing and sharing with your friends, family, and any Devils fan you know. It is completely free of charge and helps out quite a bit, though there are paid subscription options that support me even more.
Consider checking out the Devils’ Advocates Podcast, which features weekly episodes chock-full of in-depth content and exciting guest appearances. They’ll be available on this Substack, but you can also listen on your favorite platforms at the following links:
When I first started the Devils’ Advocates Substack, the goal of the publication was clear: I wanted to provide insightful, like-no-other content on the organization and its happenings. 19 months, 425 posts, and ~1,300 subscribers1 later, I think we have achieved that goal through and through. Between the analytically driven day-to-day breakdowns of acquisitions, systems, and hires; the thousands of hours spent on extensive film reviews of the Devils’ prospects and potential draftees (culminating in two 30,000-plus-word comprehensive pipeline breakdowns over two summers); and a podcast in which we have had the likes of Bryce Salvador, Dimitri Filipovic, Ken Daneyko, Brenden Dillon, and Angus Crookshank appear as guests, I’ve covered quite a bit.
One thing that I have not yet done is a true thesis — investigating a particular part of the game with analytical research and how it applies to the NHL as a whole.
Today is the day, though; let’s explore one of the more polarizing parts of the game:
Background
Faceoffs are, and have long been, one of the most divisive topics in hockey. A centerman’s worth on the ice and on the cap sheet is, in part, conventionally due to his work in the dot. Coaches deploy specific centers for specific draws depending on their success rates and handedness. Fourth-line pivots largely make their spots on the roster by virtue of their ability to win draws. Win percentage is a statistic shown commonly on broadcasts as well as player stat pages online. Of course, this results in the conventional and implicit assertion that winning faceoffs carries real weight.
That traditional question is more difficult to answer than it seems because faceoffs themselves are simply a head start to what actually happens on the ice. Any value they carry is realized indirectly and mixed in with whatever on-ice happenings determine whether or not a team is able to actually generate offense. “What happened because X team won the faceoff” needs to theoretically be separated from “what happened because X team is simply the better hockey team,” and the two are relatively inseparable in most observable data.
Faceoffs, thankfully, offer some reprieve in the sense that nearly everything independent of the result itself is already fixed by puck drop — the players on the ice, the zone, the score, the time remaining, and the strength state (5v5, 5v4, etc.) are all decided before anyone touches the puck. By holding those factors constant, we can isolate the impact a faceoff win has on what happens on the ice in the seconds that follow.
On the opposite end of the spectrum from conventional wisdom, the analytics community has covered this ground fairly well and has generally concluded that faceoffs are not quite as valuable as the attention they receive. Estimates in the public sphere suggest that 70-80 faceoff wins result in a single goal. That figure is repeated often, though the ever-evolving landscape of NHL systems, data, and personnel influences new findings and ensures that revisited research is always relevant.
This study estimates the value of a faceoff win on four measures of offensive value, using five full seasons (roughly 371,000 draws) of data. It follows the flow chart from shot attempts to shots on goal, and from shots on goal to expected goals (xG) and actual goals. The findings will be reported per strength state and zone, including 3v3 overtime and the end-of-game 6v5 draws that typically go unexamined.
Methodology
This section is the documentation of the estimates, how they were produced, and the checks they were subjected to. If you are predominantly interested in the findings themselves, you can skip right ahead to the Results section!
As much as my background in mathematics and engineering gives me certainty in my ability to ingest and understand data, I am a poor coder, through and through. The data pipeline and analysis code, then, were developed with the assistance of Claude (Anthropic). I dictated the research design and all of the modeling decisions, reviewed and interpreted all of the results, created figures in Tableau, and identified issues with the development as they arose. Additionally, I recruited the help of hockey analytics researcher CJ Turtoro to solidify the methodology and further identify and solve holes in the process. Afterwards, I had a good friend of mine, Tyler Viducic, whose Ph.D. is in particle physics, ensure that the code and results were sound. I could not have completed this project confidently without their assistance.
The Data
Step one was to retrieve the NHL’s play-by-play data for every regular-season game in the last five seasons (2021-22 through 2025-26) from the league’s public API — that’s 6,560 games, 370,890 total faceoffs, 40,471 goals, and 566,545 unblocked shot attempts. Each event carries coded information about the time, location, strength, and skater and goalie personnel. Faceoff events also record the zone, as well as the winning and losing centers. Before diving deeper into the methodology, I wanted to explain a few things:
Blocked shots are excluded from location-based metrics and are solely counted toward shot-attempt totals. Blocks, in the NHL’s data, are recorded at the location of the block, not the location of the initial shot attempt.
A pulled goalie produces two entirely different shots — one from the trailing team against a real, breathing goalie, and one from the leading team on an unguarded net. Collapsing them in either direction is a mistake; discarding both results in 16,306 attacking shot attempts being removed in order to get rid of 4,171 empty-net attempts, but keeping both drastically alters the xG model for the worse by virtue of how much weight they carry per shot. Unblocked shot attempts at an empty net are assigned their observed conversion rate of 57.4%, eight times higher than the league rate of 7.1%. That 57.4% figure is a measure of aim; an unblocked attempt either misses or results in a goal, though it should be noted that clearing attempts that span the length of the ice are sometimes recorded as shot attempts by the arena scorers, which inflates the shot attempt count but not the goal count.
Strength state is read from each individual shot’s situation code, rather than from the strength at the time of the last faceoff. Strength states do change mid-play — think about a delayed penalty bringing a game to 6v5 or a penalty expiring mid-possession — so it matters which one you read, which prevents a shot from being silently misfiled into the wrong strength bucket. Each of the 566,545 unblocked shot attempts has its own parseable code, so none fell back to a default label and corrupted the data.
Strength States
Each of the 370,890 faceoffs was broken down in part by the strength state at the time of the draw. You can see the breakdown of each strength in Figure 1:
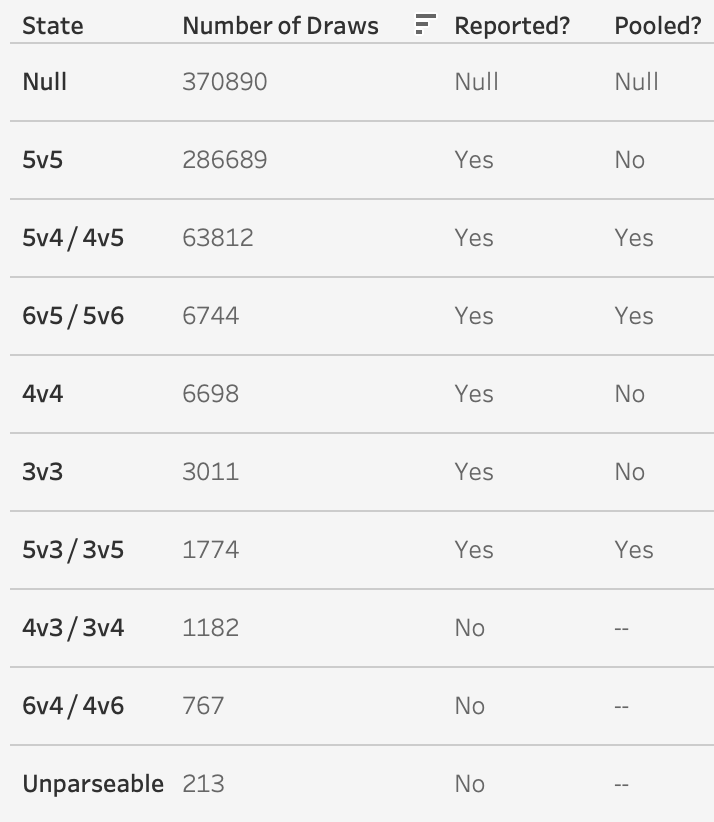
Three states will not be reported in the data: 4v3/3v4 (1,182 draws), 6v4/4v6 (767 draws), and unparseable data (213 draws). All in all, those amount to 2,162 faceoffs, which is less than 0.6% of the entire sample. They were not overlooked as a data point, but rather purposefully omitted from the report because their small sample sizes are inherently less precise and informative. Note that the 213 “unparseable” faceoffs are really two different, combined states: 147 draws where the situation codes were so rare they were lumped together in an “Unparseable” label — those are things like 6v3 (and its reciprocal), 4v5 with the goalie pulled, and 5v5 with the goalie pulled.
Because a 5v4 draw for one team is a 4v5 draw for the other (which holds for 6v5 and 5v3 as well), those events are paired. Measured as a differential — goals for minus goals against — the value of winning that draw is identical for either team, so rather than having two rows of data that say the same thing, they are one singular number.
Outcome Windows
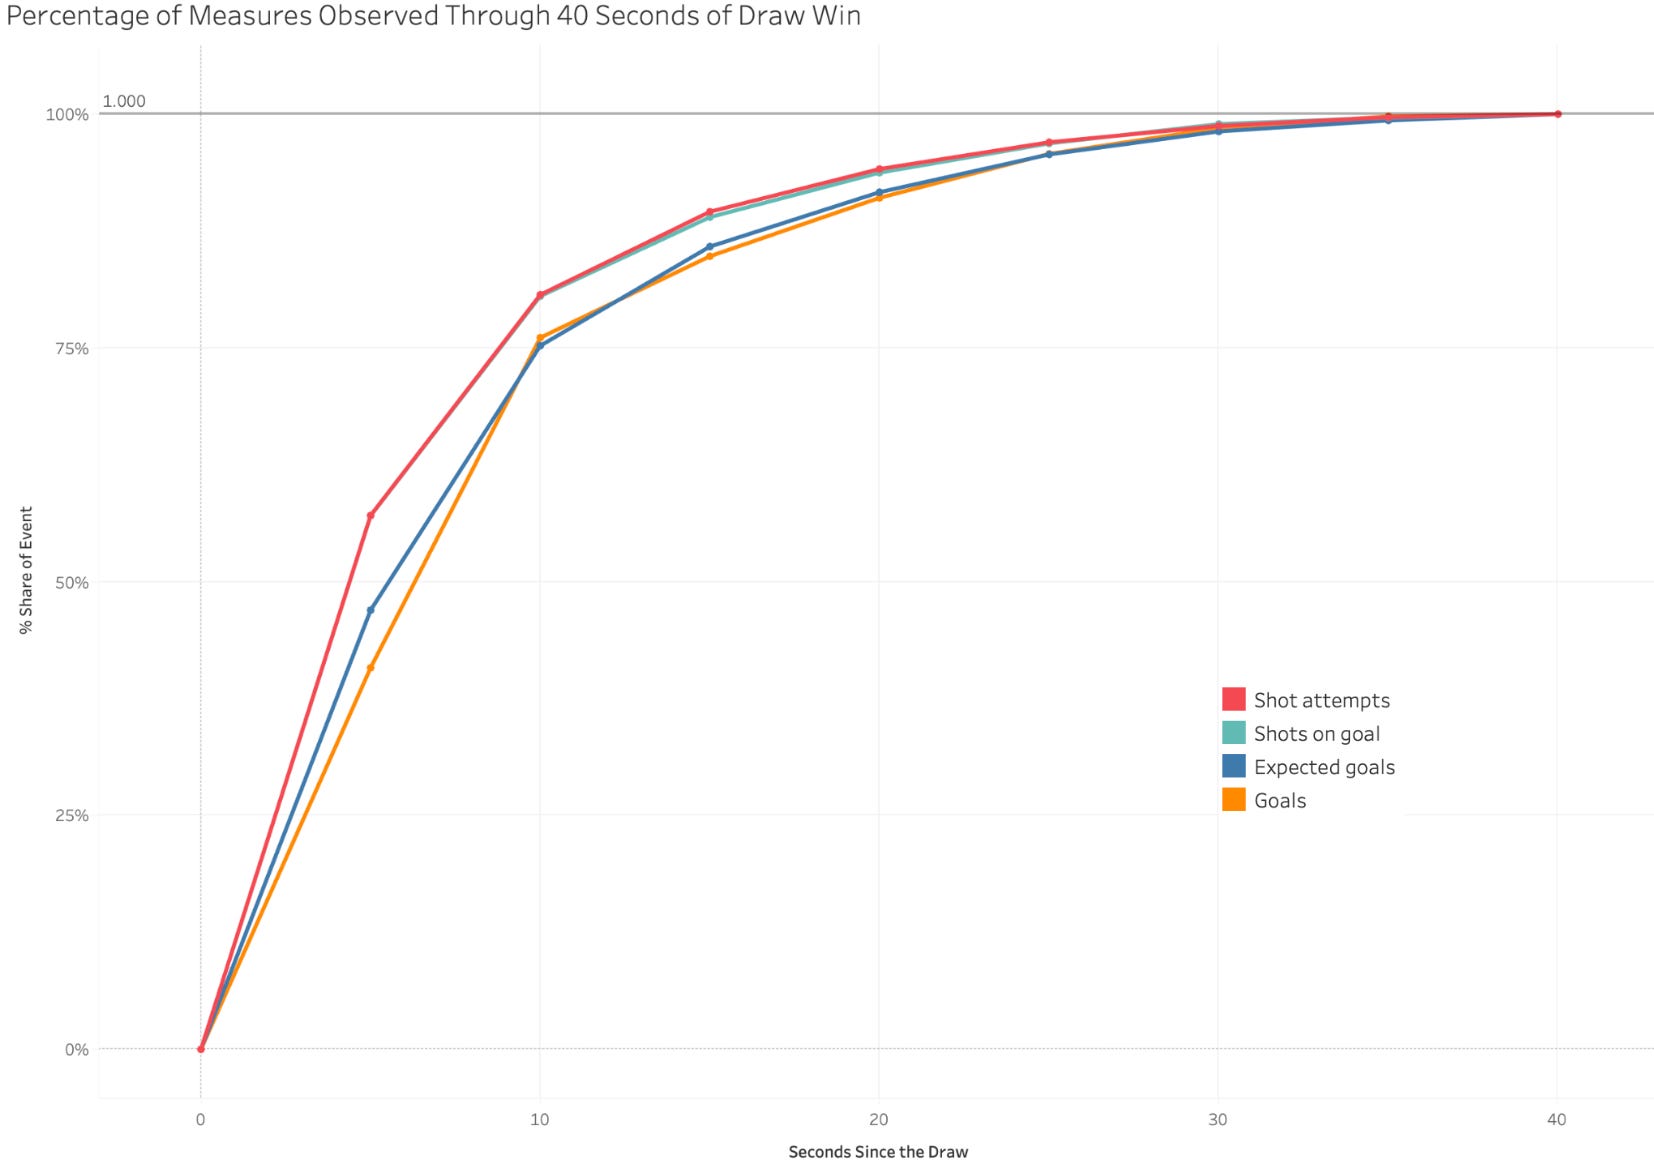
Of course, the unit of analysis here is a single faceoff. For each draw, there is an outcome window that opens when the puck is dropped and extends for 20 seconds, though it can be cut short by the next faceoff or the end of a period (whichever comes first). Within that 20-second window, outcomes are counted separately for both the team that won the draw and the team that lost it.
The 20-second window was not arbitrarily selected. To reach this conclusion, I broke the window down into five-second intervals, which ultimately showed that roughly 78% of the impact of winning a draw is realized within the first ten seconds, with over 90% of the impact occurring by the 20-second mark (see Figure 2). The 20-second interval between 20 seconds and 40 seconds produces a very small increase in overall differential for the observed metrics: 10% for the goal differential and 6% for shot attempts, to be exact.
Metrics
As mentioned previously, four metrics were reported:
Shot attempts, which were broken down into three buckets: blocked, missed, and on goal.
Shots on goal, shot attempts that actually reached the goaltender.
Expected goals (xG). For this, I created a rudimentary model. First, finishing rates were estimated on a 2.5-foot-by-2.5-foot grid over the offensive zone. This was separated for even strength, the power play, and the penalty kill. Shots and goals were counted separately in each cell, with each grid being Gaussian-smoothed before the two were divided in order to let the sparse cells defer to the traffic around them.
From there, the location rate was put through a logistic model that included a rebound indicator, strength state, and shot type.
The model was trained on the 2021-22 through 2024-25 seasons before being tested on the 2025-26 season. It has an Area Under the Curve (AUC) of 0.732, which sits below the 0.750-0.780 AUC typical of public location-based models. This is almost certainly because this model does not make any assumptions about the play leading up to the shot attempt.Goals.
Estimation & Uncertainty
The value of winning a faceoff is the difference in windowed outcomes between draws won and draws lost within the same zone and strength state. Conditioning only on those two is what keeps obvious lines of thought outside of the estimate: that an offensive-zone draw generates more offense than a neutral-zone draw and a power-play draw matters more than an even-strength one. Both teams commit before the outcome is known — as previously stated, the lines are decided, and the zone and strength state are already set.
Venue is only approximately balanced; home teams tend to win slightly more draws than away teams do by virtue of the visiting center placing his stick on the ice first, though that imbalance is small enough to be immaterial. Zone, meanwhile, is a bit trickier. An offensive-zone draw for one team is a defensive-zone draw for the other; they are the very same event viewed from opposite perspectives. On any net metric, the value of winning an offensive-zone draw and the value of winning a defensive-zone draw, then, are identical. As such, a single end-zone value is reported rather than two.
This is a property of measuring differentials rather than an actual finding about hockey. In terms of goals for, the two are unequal by nature — an offensive-zone win creates a chance for you, while a defensive-zone win prevents one against you. At 5v5, 92% of the faceoff win’s goal value is from the attacking team, whereas the other 8% is from the defending team escaping and counter-attacking.
On the power play, the two teams are not interchangeable — a team with an extra skater outshoots and outscores its opponent over any twenty-second interval regardless of who won the draw (likely because the defending team clears the puck almost immediately after gaining possession rather than trying to generate a counter), and that strength advantage is undeniably larger than the faceoff effect being measured.
Thus, it has to disappear from the estimate, vanishing only when a draw the power-play team won is compared against a draw in the same place on the ice that the power-play team lost. On the power play, then, three values are reported — a draw in the power-play team’s attacking zone, one in its own end, and one in the neutral zone. At even strength, only two values are reported: one for end zone draws and one for the neutral zone.
11 of the 14 scenarios are built the same way, with the average over one group of draws being added to the average over another group. In the nine end-zone scenarios, the two groups are the attacking team winning the draw and the defending team winning the draw. In the two others, it is an asymmetric neutral zone draw, where one group is the team with the extra skater winning and one group is the man-down team winning. In those situations, the uncertainty in each is independent of the other, and their standard errors combine to be the square root of the sum of squares √(SE₁² + SE₂²).
The other three scenarios — neutral zone draws at 5v5, 4v4, and 3v3 — are symmetric, and more or less look the same from both benches. In those scenarios, there is only one group of draws rather than two, and the value is twice that group’s average. Those three scenarios are computed with the doubled standard error rather than the two-group formula, which would have scaled the standard error by √2 instead of 2.
A block bootstrap resampling of whole games was run alongside the normal-approximation intervals to test whether in-game correlation was making them too narrow. The two agree to within a few ten-thousandths of a goal across every scenario, so clustering was not materially inflating them. Both analytic intervals and clustered intervals are computed, but it is the clustered intervals that are reported.
Player “Rankings” & Repeatability
The object of this study is to value a faceoff win in terms of its effect on the four listed metrics over a short period of time (20 seconds). The rankings it produces are a byproduct of that; they reflect faceoff work alone and say nothing about a player’s own overall value. They should not be read as a claim about talent.
To quantify a center’s value here, his win rate above 50% is multiplied by his draw volume and subsequently the value of a win, which gets separately computed by zone and scaled to an 84-game season. Under the computation, two centers with the same net faceoff differential, regardless of volume, are valued identically (i.e., a center with a 750-650 record in the dot is valued the same as a center with a 100-0 record).
A center who wins 65% of his draws over a small sample size (say, a couple hundred draws) is not necessarily a 65% center. Taking those rates at face value exaggerates the gap between best and worst, so using empirical-Bayes shrinkage pulls each rate toward the league average of 50%, pulling less and less as the center takes more draws. Each center’s games were split in half, and his win rate in one half was correlated against the other using a Pearson correlation, before subsequently being corrected using the Spearman-Brown formula. Reliability landed at 0.948.
Win rates for full seasons were compared for each center to determine the year-over-year reliability, which ultimately computed to 0.771. Priors are applied sequentially rather than pooling all five seasons and taking the average in order to compute trajectories. Centers are only included if they have at least 500 career draws and 300 in their most recent season.
The standard deviation of estimated true talent is 0.046 — a center one standard deviation above average wins 54.6% of his draws while a center one standard deviation below average wins 45.4%. The fifth percentile (42.7%) and the ninety-fifth percentile (57.8%) are separated by 0.151. The difference between the league maximum and league minimum is larger than that (0.255), but they’re also the most luck-exposed values. The 5th-95th range is stable.
Limitations
The design does not hold constant who else is on the ice outside of the centers. On-ice effects may be influenced in part (an unknown amount) by linemate quality. By the same token, the study measures the value of winning a faceoff relative to losing one, without taking into account generic changes of possession. Without the NHL API logging every change in possession, this is impossible to adjust for.
As mentioned in the xG model section, shot quality is not measured with pre-shot movement, which caps the discriminative power of the model.
Empty-net shots are scored empirically, rather than being modeled. The 4,171 shots at an unguarded net have an observed conversion rate of 57.4% rather than a location-specific probability, because a location model trained against goalies does not transfer to an empty net. xG in the 6v5 state is coarser than elsewhere as a result. Attempts in that strength state should also be read as an upper bound—clearing attempts that span the length of the ice are sometimes recorded as shot attempts by the arena scorers, which inflates shot attempts relative to goals.
Results
Far and away, the largest proportion of faceoffs sampled (187,872 of 370,890, or 50.65% of the entire sample) fell in the end zones at 5v5. There, winning a faceoff rather than losing it improves a team’s goal differential over the next 20 seconds by +0.0158 goals, with a 95% interval of +0.0145 to +0.0172. In other words, 63 more faceoff wins than losses compute to a goal for.
The second-biggest bucket of faceoffs (98,817; 26.64% of the total sample) came in the neutral zone of 5v5, and the results were expectedly quite a bit different: at that state, 192 more faceoff wins than losses compute to a goal of differential. Logically, it makes sense that neutral zone faceoff wins are less valuable than end-zone draws at any end — winning a draw near center ice still requires a zone entry or retrieved forechecking opportunity, both of which the opposition regularly interrupts.
The top panel of Figure 3 (below) describes how many faceoff wins compute to a goal for each measured strength state and zone that the puck is dropped in. It is ordered in order from fewest wins per goal (6v5, attacking zone) to most (5v5, neutral zone), with the lower and upper bounds of the 95% interval illustrated as well. Strength state and end zone combinations with fewer draws have expectedly greater differences between the bounds, with larger sample sizes resulting in less end-to-end variance.
Unsurprisingly, attacking zone draw wins at 6v5 produce the most goals per draw (+0.0532; one every 19 wins), followed closely by end-zone 3v3 draws (+0.0490; one every 20 wins) and attacking-zone 5v3 draws (+0.0419; one every 24 wins). Attacking-zone 5v4 draw wins are in a tier of their own, being worth +0.0306 per win (33 wins per goal of differential), before a steep drop-off to 4v4 end zone, 5v5 end zone, 4v4 neutral zone, 3v3 neutral zone, and 5v4 own-zone draws. 6v5 neutral zone draws only have a sample size of 396 draws, so the 95% interval is extraordinarily wide. 5v4 neutral zone and 5v5 neutral zone draw wins have a negligible effect on any goal production for the winning center’s team.
The lower panel of Figure 3 describes what happens to the shot attempts that actually result from winning a draw. As an example, while winning a faceoff in the end zone at 5v5 translates to +0.5851 shot attempts within 20 seconds, only 41% of those attempts actually reach the goalie— 35% are blocked, and 24% miss the target entirely.
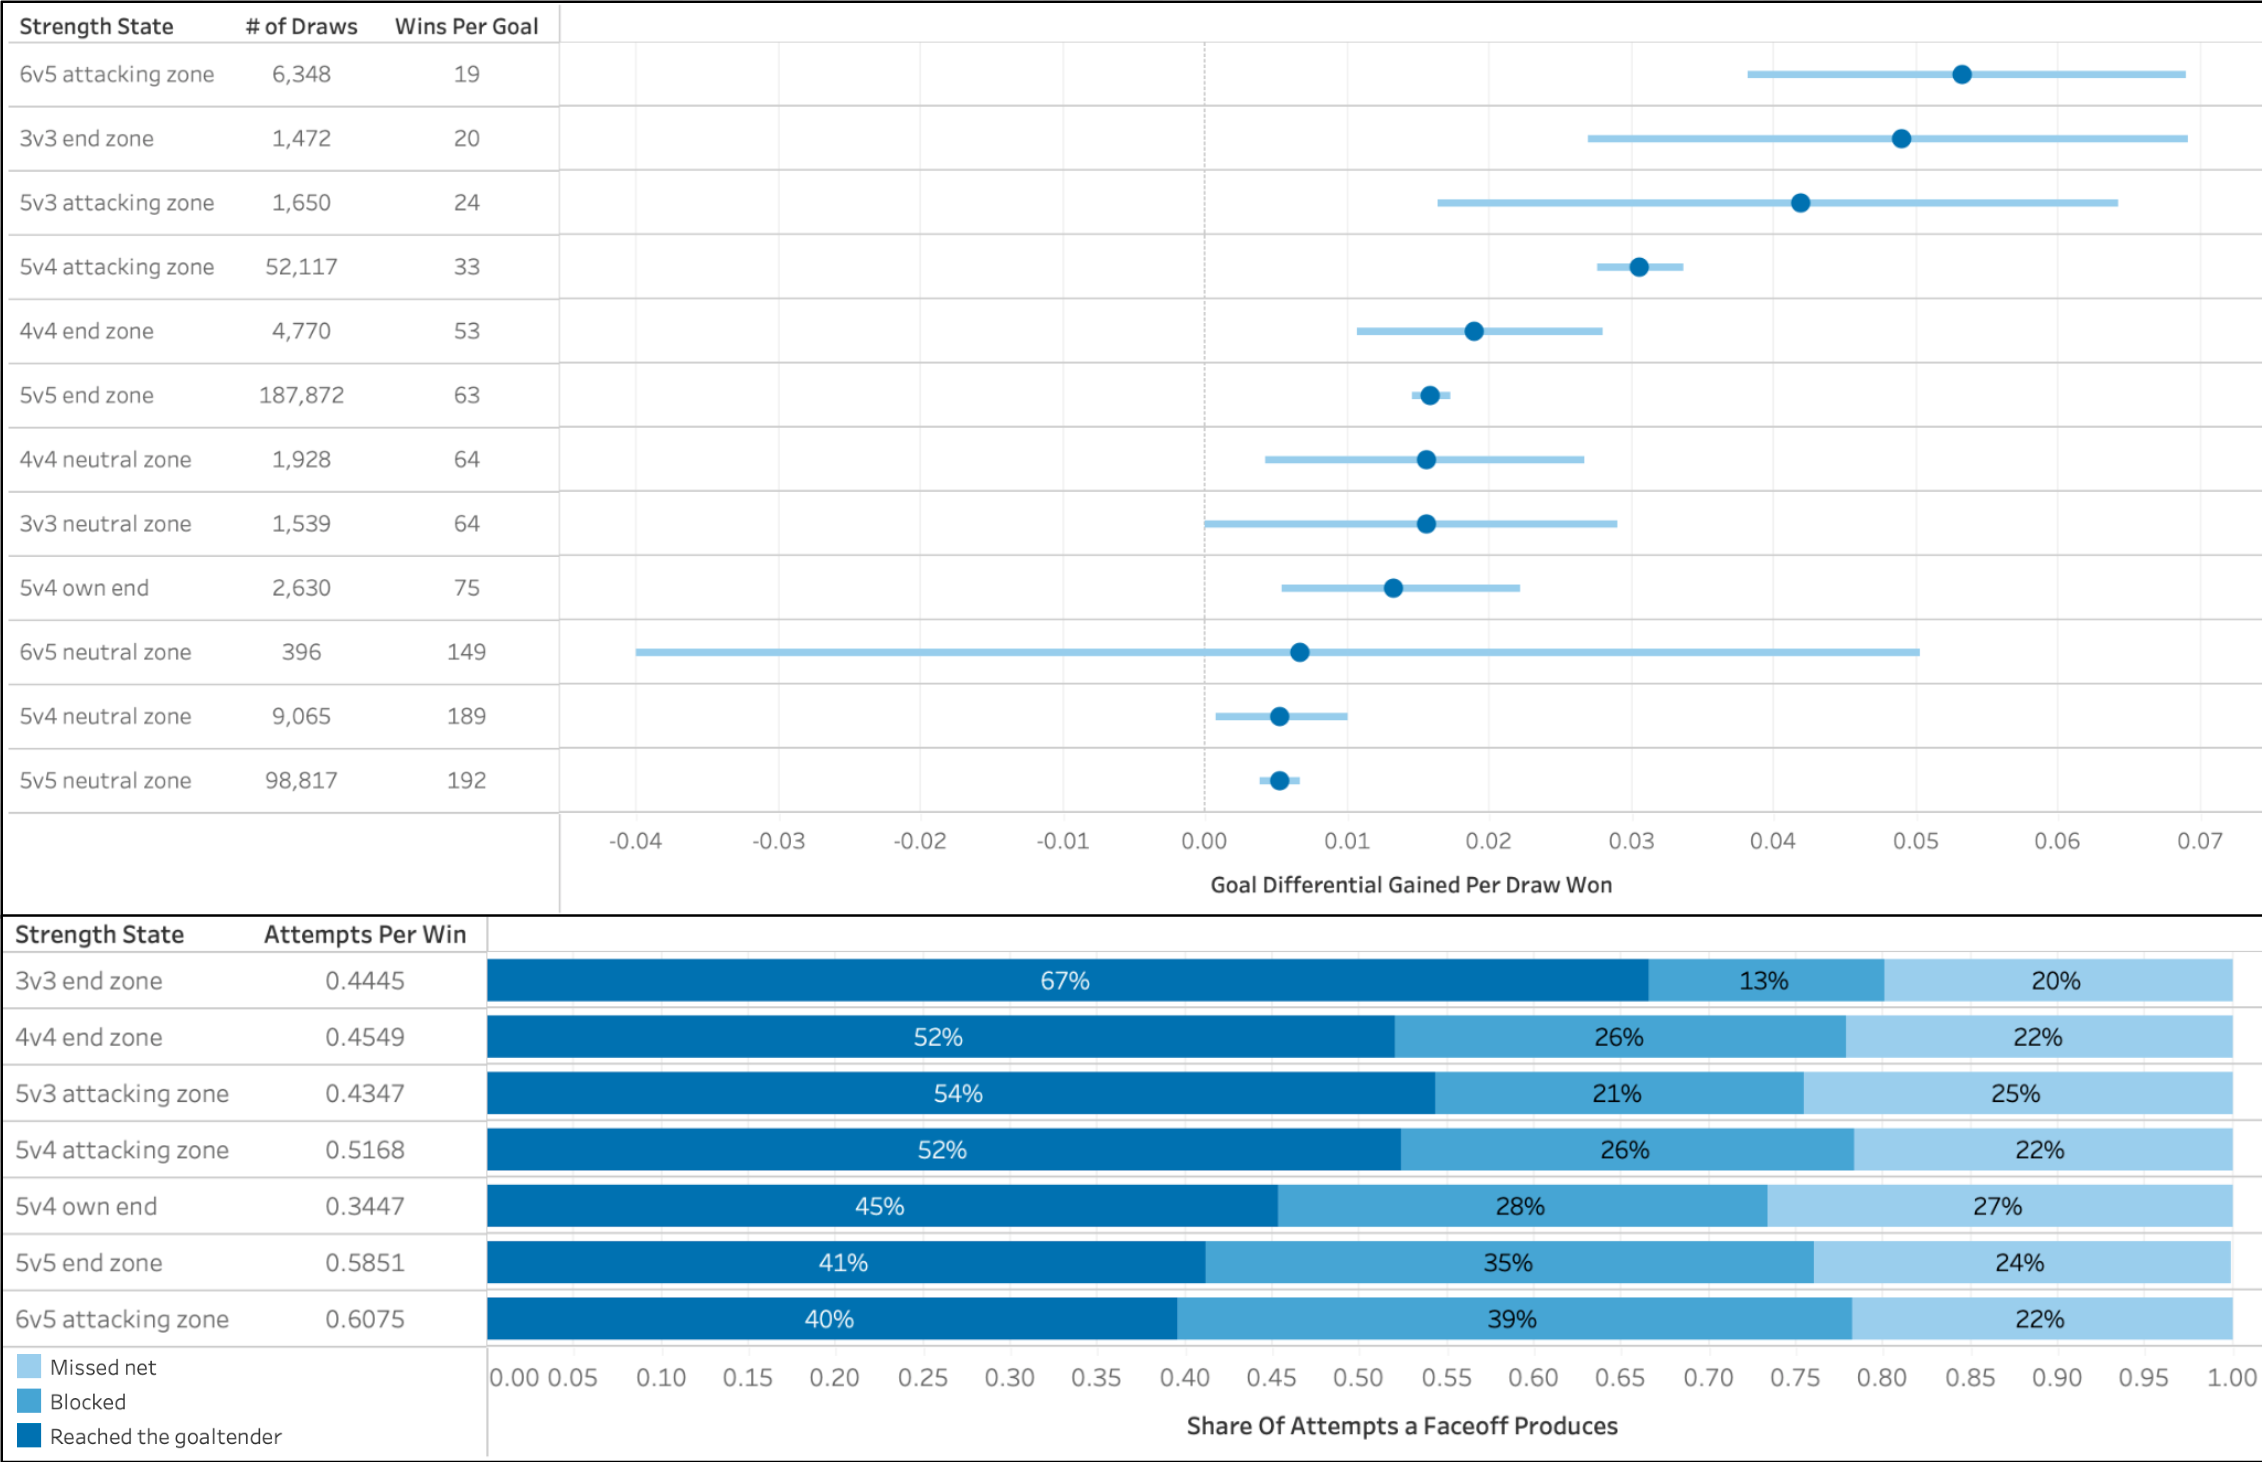
Far and away, the biggest proportion of shot attempts that hit the goaltender (67%) occur when a center wins a draw in the end zone while playing 3-on-3 — no one is actually in the shooting lanes enough to block them. Interestingly, despite resulting in the most goals per draw, the smallest proportion of shot attempts (40%) hit the net while in the attacking zone at 6v5 — defending teams tend to prioritize blocking shots in hopes that doing so will prevent a game-tying goal.
A faceoff win helps in two ways: creating offense for one’s own team, or denying it against one’s own team. At 5v5, the split is a lopsided one; 86% of the shots on goal and xG value added by winning a draw is the attacking team generating offense, with the remaining 14% being the defending team exiting their own zone and countering. This is even more drastic for shot attempts (89% vs. 11%) and, especially, for realized goals (92% vs. 8%). See Figure 4.

Interestingly, the shots that come immediately from a faceoff draw win are the lowest-converting shots in the sample by far. A puck that gets shot within two seconds of a draw being won gets saved 98.26% of the time. In subsequent two-second intervals, the save percentage declines somewhat rapidly, with shots occurring between 2-4 seconds after a faceoff is won being saved at a 94.29% clip, shots occurring between 4-6 seconds being saved 90.86% of the time, and shots occurring between 6-8 seconds getting saved 89.70% of the time. Interestingly, those shots reach the net at 91% of the normal rate, so it isn’t as though those are bad shots.
This is something we can refer to as the set goalie effect, where goaltenders are square to any potential shooters and unscreened at the time the puck is dropped, drastically increasing the likelihood of them saving the shot. As time goes by and players move positions, screens, cross-ice passes, and other factors come into play, a goaltender becomes less likely to make the stop.
Again, the purpose of this project is not to rank centers based on their faceoff ability, however, it is important to note that the difference between the best faceoff-taker in the model (Patrice Bergeron, now retired) and the worst (Jack Hughes) is just under three goals. Among active players, the difference between Hughes and the best active faceoff-winning centerman (John Tavares) is about two goals. See Figure 5 for the breakdown of the ten-best and ten-worst centers in the league in terms of the goal differential their faceoff skill is worth:
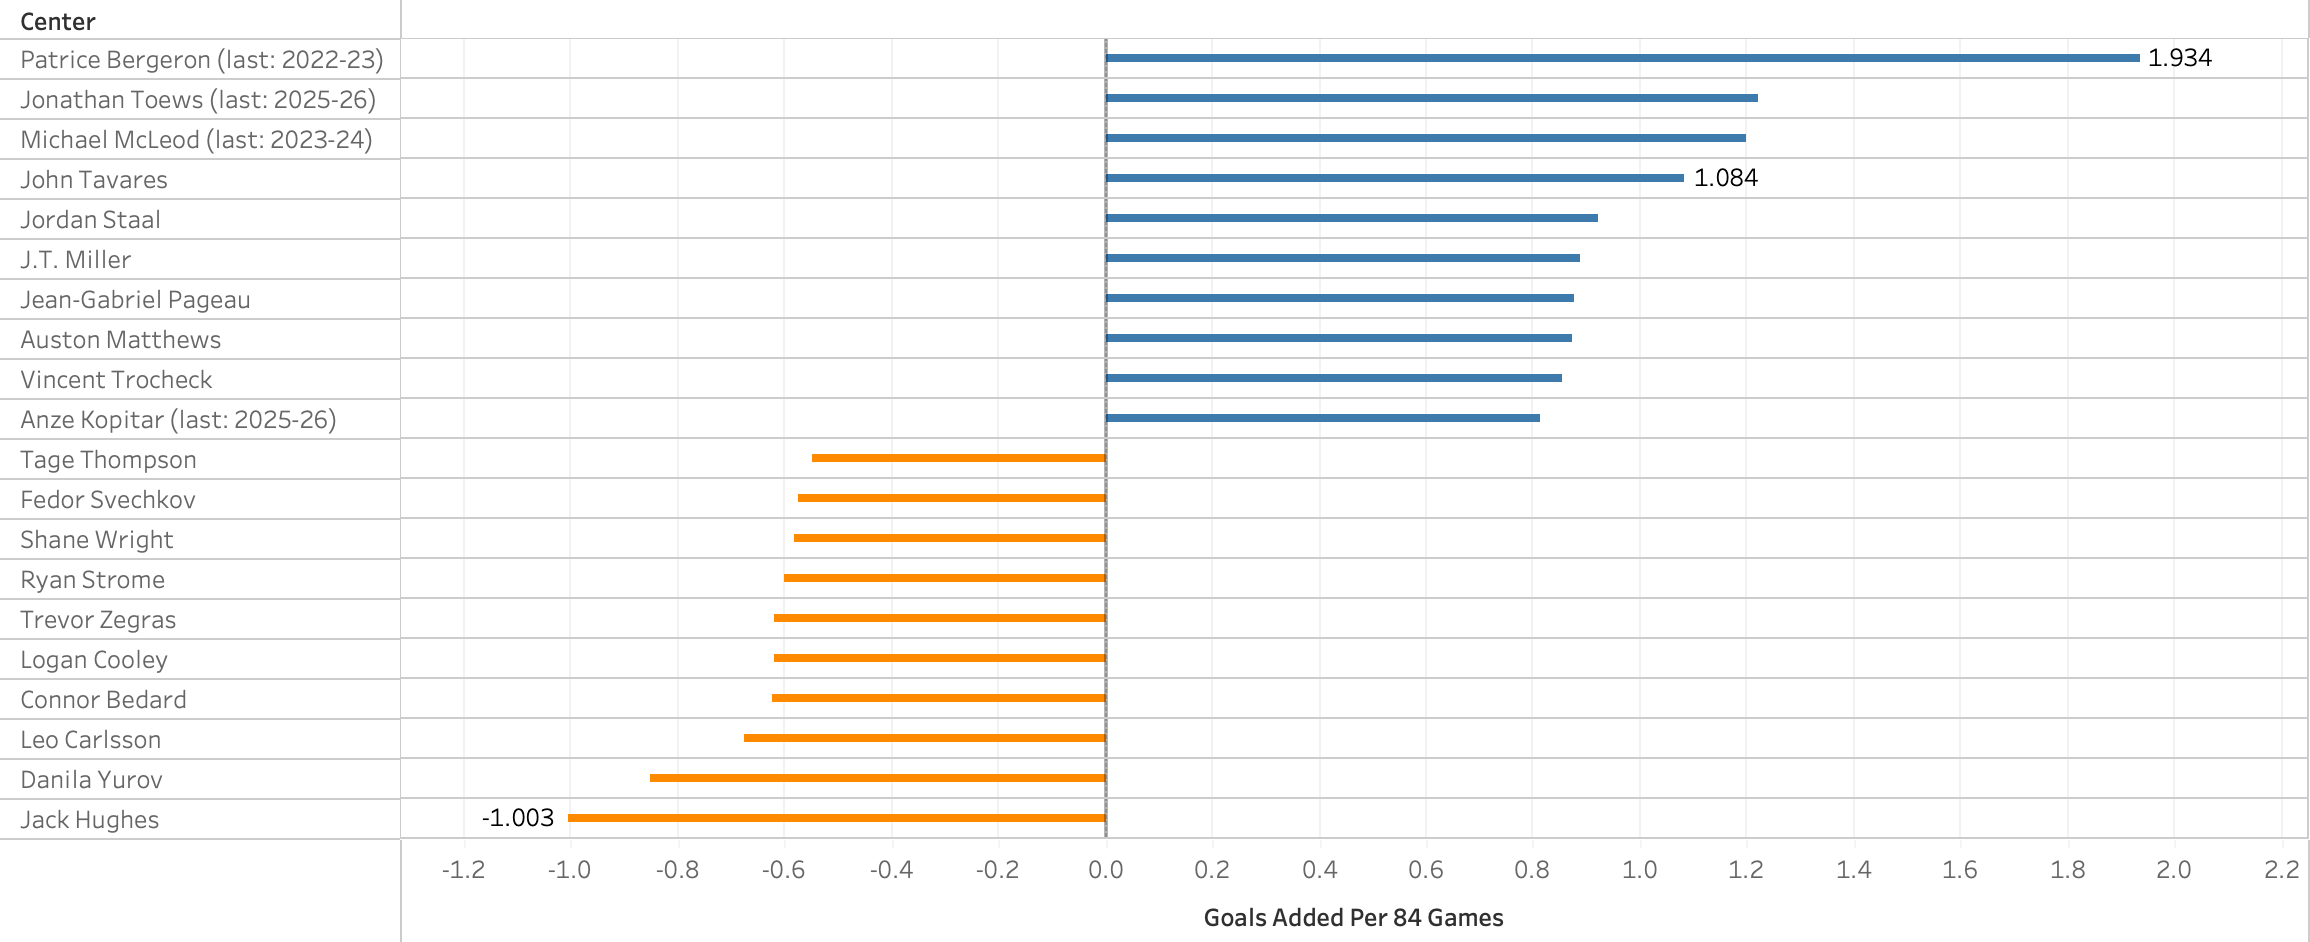
Figure 5 projects each center’s observed game-rate onto the current schedule — these are 84-game rates, rather than the 82-game seasons the model was based upon.
Concluding Thoughts
Candidly, winning a faceoff means little outside of specific scenarios (6v5 offensive-zone draws, 3v3 end-zone draws, and power-play offensive-zone draws). The most common draw in the game needs to be won 63 more times than it is lost for a goal to be realized. While a win buys more than half an extra shot attempt within 20 seconds — which seems substantial in the aggregate — following it through the pipeline gives way to the logical reasoning why the realized goal differential is so small. After all, 35% of those attempts get blocked, and an additional 24% miss the net. For the shots that do make it to the net nearly immediately after puck drop, they are faced with a square, ready-to-go goaltender who stops the puck nearly 96% of the time within four seconds.
In other words, a faceoff’s value is in kickstarting the inevitable: puck possession. In theory, as per this model, it is worth the possession edge it creates over the following 20 seconds (three-quarters of which is realized in the first ten seconds), though how much of that has to do with the win and how much of that has to do with the personnel on the ice and circumstances outside of the faceoff can only be quantified when NHL data becomes more robust.
This figure continues to increase, and it continues to leave my jaw on the floor. As always, thank you.
Nice work! One thing that crossed my mind reading this was whether you accounted for how the post-faceoff window ended? E.g. an o-zone faceoff win might result in another o-zone faceoff, and the second faceoff leads to a goal. Obviously this wouldn't have a massive effect, but ignoring it might systematically undervalue faceoff wins, and maybe especially on the powerplay.
This was fantastic. In my own research looking just at 5v5 I found essentially the same thing. A shot coming quickly after a faceoff win was a negative predictor in an xG model, but the effect in an RAPM model was a big boost in shot rates. Anecdotally, I think teams run more (and more complicated) set plays off faceoffs than they did a decade or two ago, but defensive coverage has also adapted in response and, as you mentioned, goalies are more set and ready off a faceoff than in open play.
The value on 6v5 and PP attacking wins is really interesting though. It does lend some support to the FOGO strategy, although I wonder if having your center sprint to the bench after winning the faceoff suppresses the value a bit.